
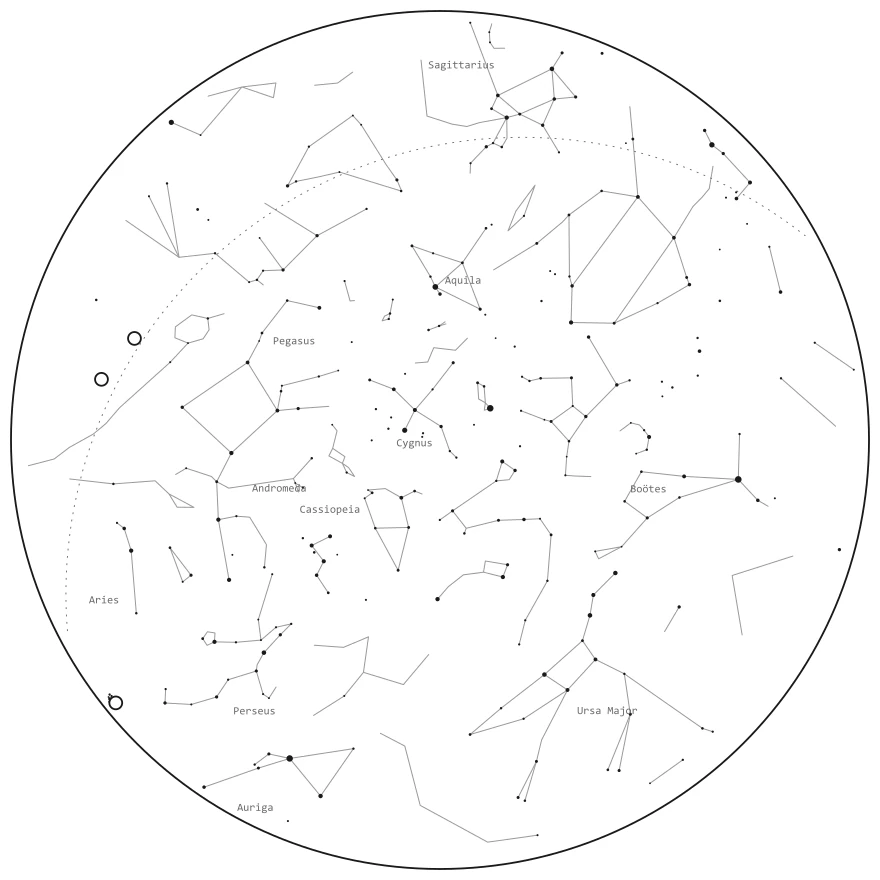
In 2026 I work as a volunteer on Un art voulu voyant, the research and art project of Florian Rosinski. One of its tools, Observations, composes a sheet of the sky for a date, an hour and a place. Computing it took an engine.
That engine is now called astralmanach: a JavaScript library published on npm, a public API and three tools. This note says why I took it out of the project, and what I learned doing it.
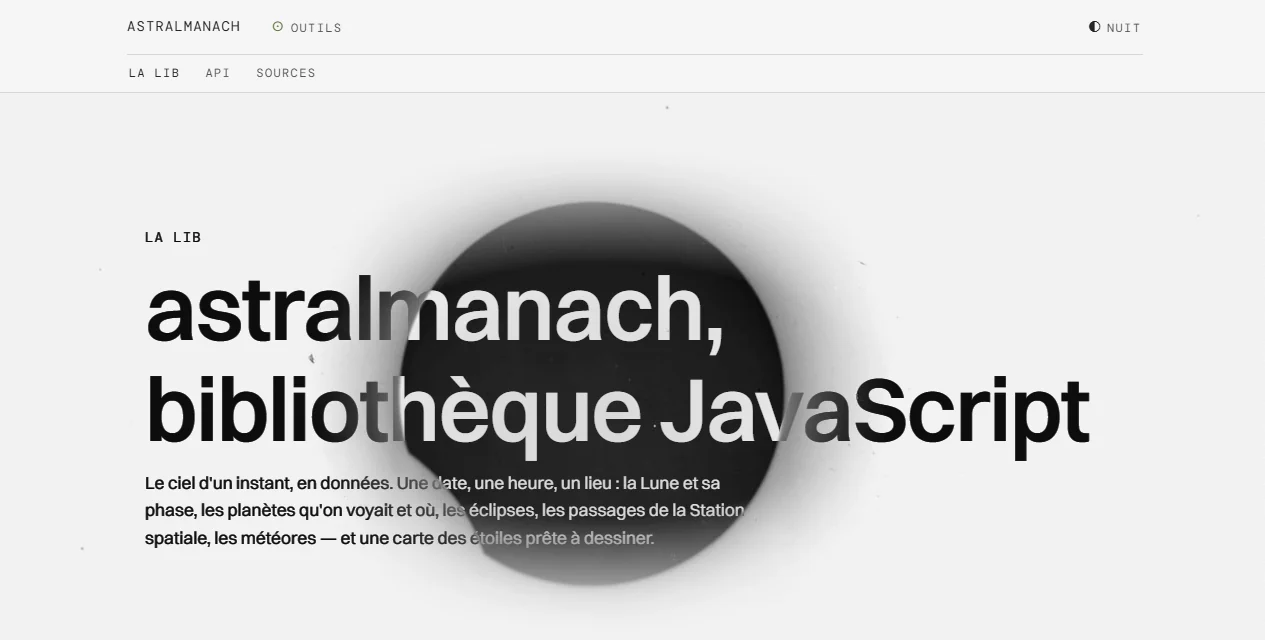
astralmanach.eu: the library, its API and its tools.
Where it comes from: Observations
You enter a date, an hour and a place, as for a birth chart. But what comes back is an astronomical chart: observed reality, assembled as a collage. The tool's page says it this way, in French: the astronomical chart draws on the history of photographs of space to place your birth in the universe.
It is a reversal. A birth chart borrows the clothes of science: degrees, aspects, vectors. The astronomical chart does the opposite: it starts from real measurements, and presents them as an assembly of images.
The output is an A4 sheet, made to be printed. It reads from the bottom up, from the body that looks to the sky:
- at the top, the astronomy picture of the day, whose lower edge is a horizon: an outline in pixels that the risen bodies lift, each at its azimuth;
- on that picture, the star map, in a disc centred on the zenith;
- in the middle, an observer;
- at the bottom, an observatory webcam.
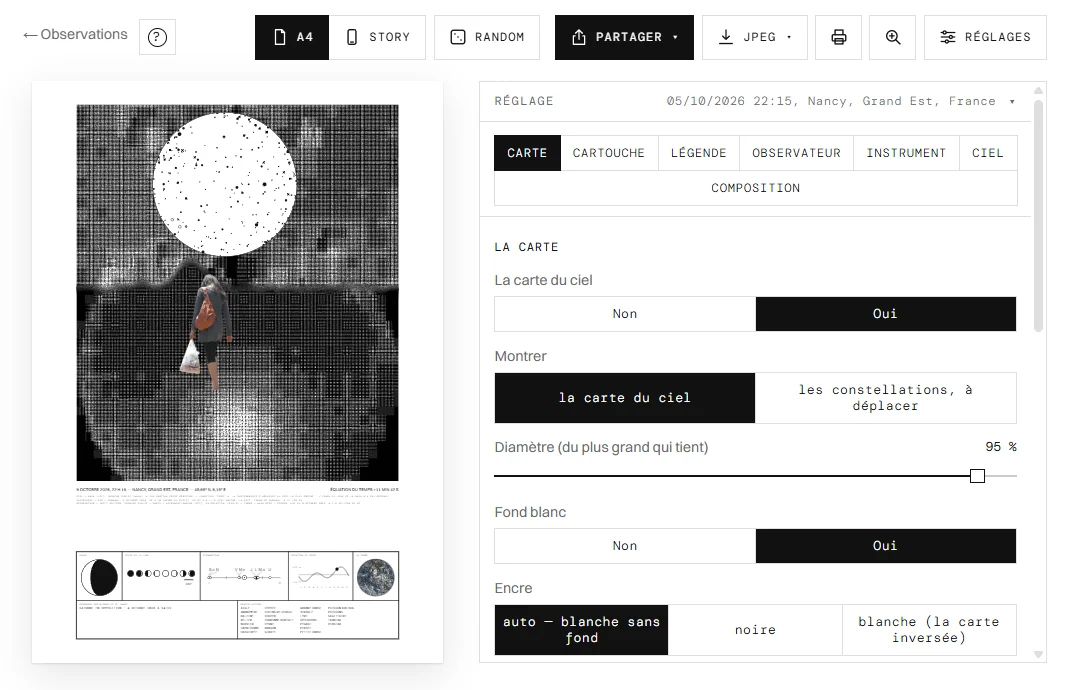
Observations, on uavv.fr: the sky of Nancy on 5 October 2026 at 22:15. The map, the Moon and the planets come from the library. The NASA and ESO images are credited on the sheet.
Three rules of this project serve me well beyond it.
Settings rather than a fixed choice. It is what the artist asked for: multiply the adjustable options rather than hard-code a choice. Every value of the sheet is therefore a setting, with a seed for chance.
Printable from the start. Everything is described in millimetres, in a single table read by the screen and by the print. What is computed is vector, the images are bitmaps at 300 dots per inch at least. The trap to avoid: a screen-first site that finds out too late that it cannot produce a printable file.
Nothing that needs a permission. Public domain or open licences only. What requires an agreement is set aside, and written down as such. Images from meteor detection networks were ruled out that way: they belong to their operators.
Why make it a library
At first a single repository held everything: the site of the art project, the tools, and the sky calculation in the middle. For a volunteer project that raised three problems.
- The project and the tools are two things. An artist's site should live in his own repository, with its history. The tools needed an address of their own.
- Twin files. Several files existed twice, kept in step by hand from one site to the other.
- A locked-in calculation. Nobody else could use it, or check it.
On 30 September 2026 we decided: split. The project's site went to Florian's repository. The public tools kept theirs. And the sky engine that Observations needs became a public package on npm, under the MIT licence.
What that changes in the long run:
- The artist's site depends on a versioned package, not on my working folder. If I stop, the package stays installable and the site keeps running.
- A library has a contract. Types, tests, a changelog, version numbers that mean something. Publishing to npm is done by continuous integration when I push a version tag, with a provenance attestation.
- The tools have almost nothing to maintain. No database, no account, no private area: one NASA API key is enough.
Versions 0.1.0 and 0.2.0 came out on 30 September 2026, 0.2.1 the day after. It is an ESM package, typed, for Node 20 and above.
What the library does
There are excellent astronomy libraries in JavaScript. astralmanach does not replace them: it builds on them. Positions come from astronomy-engine, orbits from satellite.js, the stars and constellation figures from the catalogues of d3-celestial.
It answers the question those libraries leave open: what did the sky look like, here, at that moment, in words and in shapes?
import { skyRecap } from "astralmanach";

const r = skyRecap({
  date: "2026-09-30",
  time: "21:00",
  place: { name: "Paris", lat: 48.8566, lon: 2.3522, tz: "Europe/Paris" },
});

console.log(r.headline); // the Moon, the Sun, what could be seen with the naked eye
The star map is not a drawing: it is data. The stars, the constellation lines and their names are projected into a disc. It is up to you to draw them in SVG, on a canvas or in a PDF.

Paris, 30 September 2026, 19:00 UTC. Every point and every line comes from skyMap(). The drawing takes 60 lines of SVG.
Four principles hold it together:
| Principle | What it means |
|---|---|
| No secrets, no disk | The library reads no file and no environment variable. The key, the User-Agent and the cache are passed in. Keys are redacted from everything it returns. |
| Never throws | A source that fails gives a result with a status and a message. The page always renders. |
| Compute locally | Everything that can be computed is computed locally. Only the Space Station and the fireballs go to the network. |
| Civil time, done right | A date is local to the place, with its time zone and daylight saving time. Without an hour, the instant is noon. |
The API: a playground
The site serves a read-only API on the same engine. No account, no key, and it can be called from any site. It is described in OpenAPI 3.1 and ships with a Postman collection.
Its documentation page is above all a place to try it: you choose a source, a date, a place, and the request leaves from the page. You see the address called, the status, the response time, and the results.
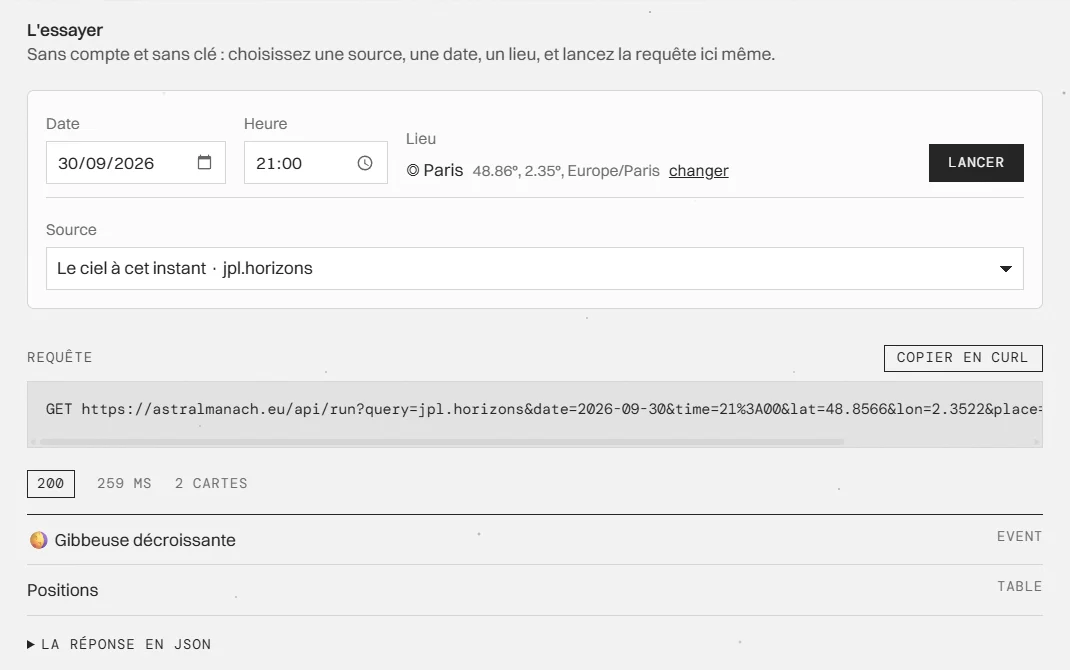
The API page. Here the Moon, from JPL Horizons: 200, 259 ms, two cards.
The same request, outside the browser, and an excerpt of its answer:
curl "https://astralmanach.eu/api/run?query=jpl.horizons&date=2026-09-30&time=21:00&lat=48.8566&lon=2.3522&place=Paris&ptz=Europe%2FParis"
{
  "queryId": "jpl.horizons",
  "note": "vu du centre de la Terre, 30 septembre 2026 à 21:00",
  "status": "ok",
  "cards": [
    {
      "kind": "event",
      "title": "🌖 Gibbeuse décroissante",
      "facts": [
        ["Éclairée", "80 %"],
        ["Constellation", "Taureau"],
        ["Distance", "369 691 km"]
      ]
    }
  ]
}
Every source answers in the same shape: cards. A title, facts, links, a time. That is what makes it possible to plug in 34 of them without writing 34 displays. The labels are in French today; the numbers and instants are language-free.
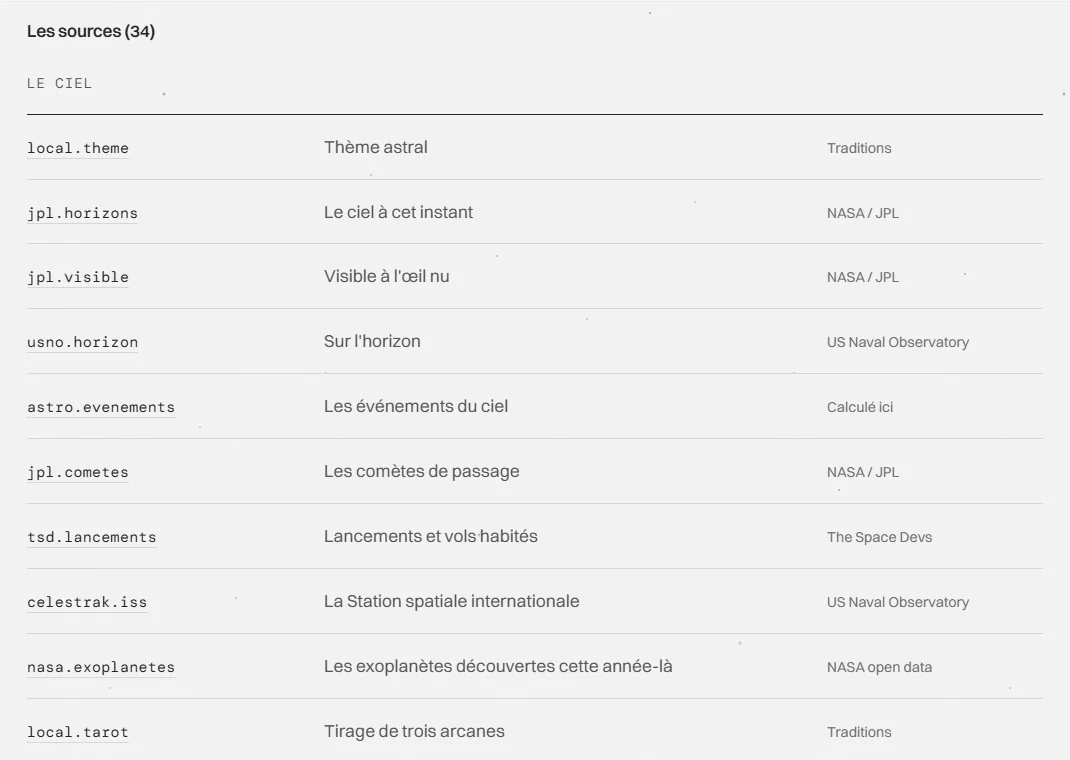
The registry: 34 sources, from NASA to calculations done locally.
Plugging in 34 sources quickly teaches that every provider has its rules:
- NASA's demo key is heavily limited, a real key takes a minute to get;
- Launch Library accepts fifteen requests an hour without an account;
- Wikimedia requires a
User-Agentthat says who is calling; - CelesTrak asks you to cache its data rather than hammer it;
- Space Station passes are not computed more than six days away from the latest orbital elements: an old orbit would give a wrong result, so the library refuses.
These rules are written in the documentation, with the list of keys and sign-ups you need to run the library yourself.
Three tools, the same library
The site offers three tools, which are three uses of the same package:
- Thème: what astrology and the world's traditions read;
- Ciel: what was observed that day, never astrology;
- Certificat: the same sources, put into sentences.
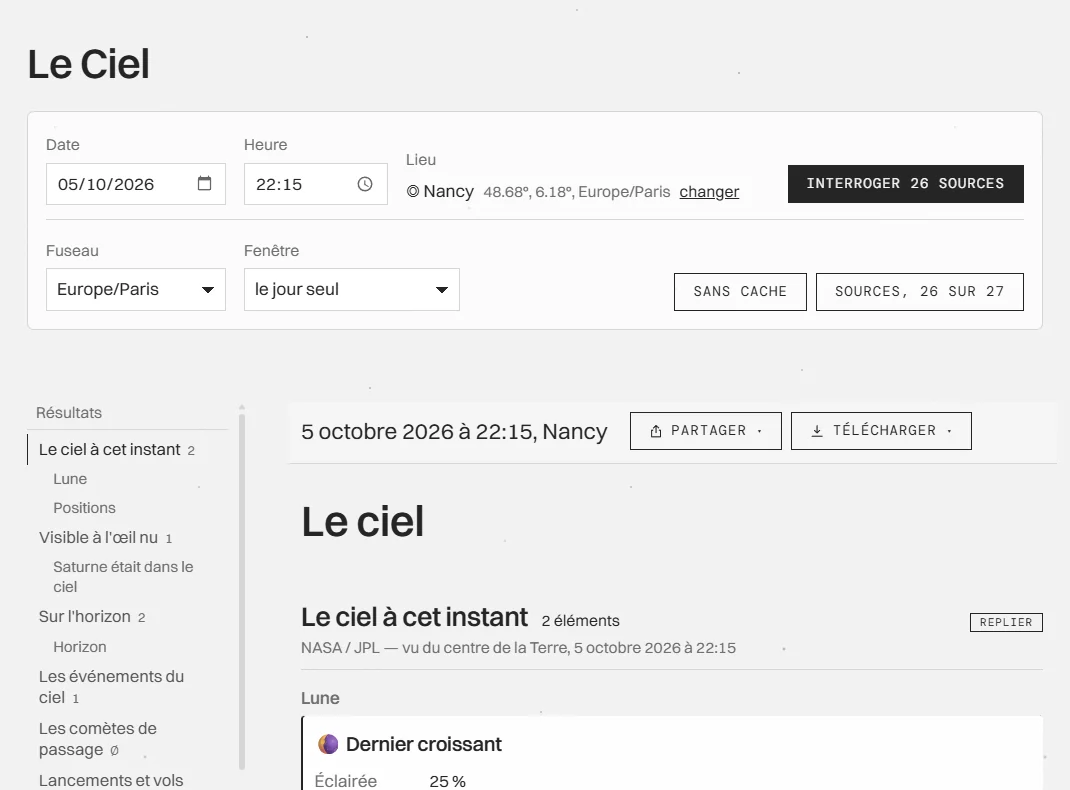
Ciel: 26 sources queried for Nancy, 5 October 2026 at 22:15.
What I take from it
- Taking the engine out said who owns what. The artist has his site and his repository. The library belongs to everyone. The tools are one use among others.
- A volunteer project lasts if someone else can run it without me. Hence the package, the documentation, an API you can try without signing up, and licences credited one by one.
- The limits are written down. The labels are in French only. The package ships three sources, the registry of 34 lives in the site. And it is a 0.2 version: young.
To go and see: the package on npm, the repository, the API, and Observations, where it all began. The other side of the same project, the hands, is told in Thirty hands, forty videos.